Where
is Boeing Going?
Part 5 : Boeing's Planes - Key
Facts and Figures
|
|
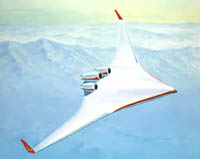
A 2000 NASA sketch of a Blended Wing Body plane.
Many
industry watchers believe this developing such a radical new
type of plane presents as Boeing's best strategy for the
future.
Part
5 of a 5 part series - click for Parts
One
Two
Three
Four
Five |
Here is some interesting
information and 'facts and figures' that provides a quantitative
background to our largely qualitative analysis in the first four
parts of the series on Boeing.
This information is updated on
a regular basis.
Chart 1 : Comparable Plane
Performance
The break in these lines
shows the change from propeller to jet powered planes.
There was fairly clear and
steady progress until the jet age, but since that time, new
plane designs were not based simply on 'bigger/better/faster'
but instead on segmenting the market into different types of
plane.
The range line has continued
to increase, but the speed line has stayed flat.
Table 1 : Source Data for Chart
1
| Plane |
First Commercial Flight |
Initial Passenger Capacity |
Speed |
Initial Range |
|
B&W |
1916 |
1 |
67 |
320 |
| Model 40 |
1927 |
2 |
105 |
650 |
|
Model
80 |
1928 |
12 |
125 |
460 |
| 247 |
1933 |
10 |
189 |
745 |
|
314
Clipper |
1938 |
74 |
184 |
3500 |
| 307 Stratoliner |
1938 |
33 |
220 |
2400 |
|
377
Stratocruiser |
1947 |
100 |
300 |
4200 |
| |
|
|
|
|
|
707 |
1957 |
181 |
605 |
3000 |
| 727 |
1964 |
131 |
570 |
3110 |
|
737 |
1967 |
107 |
575 |
1150 |
| 747 |
1970 |
420 |
585 |
6000 |
|
757 |
1982 |
210 |
530 |
3800 |
| 767 |
1982 |
255 |
550 |
5600 |
|
777 |
1995 |
368 |
557 |
5955 |
| 787 |
2011 |
250 |
567 |
7800 |
|
737 update |
~ 2017 |
|
|
|
|
|
This table is a simplistic
attempt to portray the evolution of Boeing's entire and broad
product range. It reports only the range and passenger carrying
capacities of the launch model of each series. Subsequent new
models are likely to have quite different characteristics,
carrying more (or fewer) passengers and for a greater (or
lesser) distance.
Table 2 : Comparative Jet Plane
Developments
|
Year |
Boeing |
Airbus |
|
1954 |
Dash-80 prototype first
test flight |
|
|
1955 |
|
|
|
1956 |
|
|
|
1957 |
707-120 FCF |
|
|
1958 |
|
|
|
1959 |
|
|
|
1960 |
|
|
|
1961 |
|
|
|
1962 |
|
|
|
1963 |
|
|
|
1964 |
727-100 FCF |
|
|
1965 |
|
|
|
1966 |
|
|
|
1967 |
727-200
FF |
|
|
1968 |
737-100 FCF
737-200 FCF |
|
|
1969 |
|
A300B FF |
|
1970 |
747-100 FCF |
|
|
1971 |
747-200
FCF |
|
|
1972 |
|
|
|
1973 |
|
|
|
1974 |
|
A300-B2 FF |
|
1975 |
|
|
|
1976 |
747SP FCF |
|
|
1977 |
|
A300-B4-100 FCF |
|
1978 |
|
|
|
1979 |
|
|
|
1980 |
|
|
|
1981 |
|
|
|
1982 |
767-200 FCF |
|
|
1983 |
757-200 FCF
747-300 FCF |
|
|
1984 |
737-300 FCF
767-200ER FCF |
A300-600 FCF
A310-200 FCF
A310-300 FCF |
|
1985 |
|
|
|
1986 |
767-300 FCF |
|
|
1987 |
|
|
|
1988 |
737-400 FCF
767-300ER FCF |
A320-200 FCF |
|
1989 |
747-400
FCF |
|
|
1990 |
737-500 FCF |
|
|
1991 |
|
|
|
1992 |
|
|
|
1993 |
|
A340-200 FCF |
|
1994 |
|
A321-100 FCF
A330-300 FCF |
|
1995 |
777-200 FCF |
|
|
1996 |
|
A319-100 FCF |
|
1997 |
777-200ER
FCF |
A321-200 FF |
|
1998 |
737-600 FCF
737-700 FCF
737-800 FCF
777-300 FCF |
A330-200 FCF |
|
1999 |
757-300
FCF |
A318 FF |
|
2000 |
767-400ER FCF |
A340-300 FCF |
|
2001 |
737-900
FCF |
|
|
2002 |
747-400ER FCF |
A340-500 FCF
A340-600 FCF |
|
2003 |
|
A318 FCF |
|
2004 |
|
|
|
2005 |
|
A380-800 FF |
|
2006 |
|
|
|
2007 |
|
A380-800 FCF |
|
2008 |
|
|
|
2009 |
|
|
|
2010 |
787 FF |
|
|
2011 |
787 FCF
747-8F FF
747-8F FCF |
|
|
2012 |
|
|
|
2013 |
|
A350 FF |
|
2014 |
|
A350 FCF ? |
|
2015 |
|
A320neo FCF
? |
|
2016 |
|
|
|
2017 |
re-engined 737
? |
|
|
2018 |
|
|
|
2019 |
|
|
|
2020 |
|
|
|
|
This table generally shows
the year that each plane flew for the first time commercially (FCF).
Occasionally, it may also show the year the plane flew for the
first time (FF).
Launch models of new product
lines are shown in bold. Derivative models are not bolded.
Note that we are not
considering the A318, A319, and A321 as new model planes, but
instead consider them all as part of the A320 family.
Table 3 : Comparative annual
deliveries of planes
|
Year |
Boeing deliveries |
Airbus deliveries |
|
1974 |
284 |
4
first deliveries |
|
1975 |
255 |
8 |
|
1976 |
207 |
13 |
|
1977 |
156 |
15 |
|
1978 |
243 |
15 |
|
1979 |
360 |
26 |
|
1980 |
363 |
39 |
|
1981 |
359 |
38 |
|
1982 |
232 |
46 |
|
1983 |
266 |
36 |
|
1984 |
200 |
48 |
|
1985 |
285 |
42 |
|
1986 |
344 |
29 |
|
1987 |
374 |
32 |
|
1988 |
420 |
61 |
|
1989 |
284 |
105 |
|
1990 |
385 |
95 |
|
1991 |
435 |
163 |
|
1992 |
446 |
157 |
|
1993 |
330 |
138 |
|
1994 |
272 |
123 |
|
1995 |
207 |
124 |
|
1996 |
219 |
126 |
|
1997 |
321 |
182 |
|
1998 |
510 |
229 |
|
1999 |
573 |
294 |
|
2000 |
492 |
311 |
|
2001 |
527 |
325 |
|
2002 |
381 |
303 |
|
2003 |
281 |
305 |
|
2004 |
285 |
320 |
|
2005 |
290 |
378 |
|
2006 |
398
> 320 (est
Jan06)
revised to 375-385 in Feb 06
revised to almost 400 late in 06 |
434
'more than
400' est in Jan06 |
|
2007 |
441 worth
$50 billion list price
mid 400s
est Dec 05 |
453 worth
$42 billion list price |
|
2008 |
375
(a 2 month strike impacted deliveries by
an estimated 62 planes)
just
under 500 est Dec 05
485 est Jan 08 |
483 actually
delivered
500 est
early Jan
08
more than 470 est mid Jan 08 |
|
2009 |
481
more than
500 est Dec 05
480-485 est Jun 09 |
498
525 est
early
Jan 08
440-450 est Mar 09 by analyst
483 est Apr 09 by Airbus |
|
2010 |
462
more than
500 est Dec 05
460 - 465 est Jan 10 |
510
400 est
Mar 09
480-500 est Jan10 |
|
2011 |
477
485 - 500
est Jan 11 |
534 |
|
2012 |
601 |
588 |
|
2013 |
648 |
626 |
|
2014 |
723 |
629 |
|
2015 |
762 |
635 |
|
2016 |
748 |
688 |
|
2017 |
763 |
718 |
|
2018 |
806 |
800
'close to 800' (claimed in Jan 18) |
|
2019 |
380
737MAX grounding |
863 |
2020
(Covid) |
157
737 MAX grounding |
566 |
|
|
At the end of 2003, Boeing
had approximately 1100 planes on order. Airbus had 1500.
At the end of 2005, Boeing had 1809 planes on order and
Airbus 2177. At the end of 2006, Airbus had 2,533 planes
on order. At the end of 2007, Airbus had 3,421 planes on
order and Boeing had 3,400 planes on order. At the end of
2011, Boeing had 3,771 planes on order and Airbus had 4,437.
At the end of 2013, Boeing had 5,080 orders (3,680 for the 737,
916 for the 787, 380 for the 777, 55 for the 747 and 49 for the
767) and Airbus had 5559 orders in its backlog. At the end
of 2014, Airbus had a backlog of 6386 planes - about nine years
of production.
At the end of 2016, Boeing's
backlog was 5,715 planes on order, and Airbus had 6,874 planes on
order.
At the end of 2017, Airbus had
a backlog of 7,256 planes and 7577 at the end of 2018.
At the end of 2019, Airbus
counted 7482 planes in its order backlog, and Boeing had 5406.
At the end of 2020, Airbus had
7,184 planes in backlog, and Boeing had 4,223.
Table 4 : Comparative annual
orders for planes
|
Year |
Boeing new
orders |
Airbus new
orders |
|
1989 |
563 |
421 |
|
1990 |
456 |
404 |
|
1991 |
240 |
101 |
|
1992 |
230 |
136 |
|
1993 |
220 |
38 |
|
1994 |
112 |
125 |
|
1995 |
|
106 |
|
1996 |
435 (+
40 McDonnell Douglas) |
269 or
maybe 326 |
|
1997 |
|
460 |
|
1998 |
|
556 |
|
1999 |
368 |
379 or
maybe 476 |
|
2000 |
602 |
520 gross;
441 |
|
2001 |
314 |
375 gross;
274 |
|
2002 |
250 |
348 gross;
233 |
|
2003 |
250 |
331 gross;
254 |
|
2004 |
277 |
447 gross;
366 |
|
2005 |
1029
(gross before future cancellations)
1002 net |
1111 gross;
1055 net |
|
2006 |
1050 gross;
1044 net |
824 gross;
790 net |
|
2007 |
1423 gross;
1413 net
list price $171 billion
(Boeing's best year to date) |
1458 gross;
1341 net
list price $157 billion
(cancelled A350 orders explain the big
difference) |
|
2008 |
662 net |
900 gross
777
net (est) |
|
2009 |
263 gross;
142 net |
310 gross,
271 net |
|
2010 |
625 gross,
530 net |
644 gross,
574 net
250-300
proj Jan10 including 4 orders totalling
less than 10 A380s |
|
2011 |
921 gross;
805 net |
1608 gross;
1419 net |
|
2012 |
1339
gross; 1203 net |
914 gross; 833 net |
|
2013 |
1531 gross;
1355 net |
1619 gross;
1503 net
(Airbus' best year ever) |
|
2014 |
1550
gross; 1432 net
(Boeing's best year
ever) |
1456 net |
|
2015 |
878 gross;
768 net |
1080 |
|
2016 |
848
gross; 668 net |
949 gross; 731 net |
|
2017 |
1053 gross; 912 net |
1229 gross; 1109 net |
|
2018 |
893 net |
747 net |
|
2019 |
-87 net |
768 net |
2020
(Covid) |
-1026 net |
383 gross, 268 net |
|
|
Counting orders is as much
an art as a science, because each year sees a mix of 'firm'
orders, provisional orders, letters of intent, and options being
secured. Plus, some options and other non-firm orders
convert to firm orders, and even some firm orders are cancelled.
And an airline might change an order for one type of plane to an
order for a different type of plane, or might give/sell its
place in line for future deliveries to another airline.
Some orders get delayed so
repeatedly as to be meaningless (think Virgin Atlantic and its
A380 orders) and other orders are clearly never going to occur
because the airline in question lacks the financial strength to
survive and pay for the planes when they start to be delivered.
Making a consistent
determination from this morass of order-type activity into what
actually represents real, definite, and certain new business is
very difficult, and there is every chance that different sources
will record different numbers. Treat the numbers in the
table above with caution.
It is also worth noting that
both the preceding two tables do not distinguish between small
planes and large planes, and so the numbers of planes does not
directly match the dollar values. Should a 737
order/delivery be equated with a 747 delivery; a 319 with a 380?
For example, in 2005, Boeing's 1029 orders represented a list
price total of about $116 billion, whereas Airbus' 1111 orders
represented about $96 billion. This was because Boeing's
orders in 2005 were more strongly skewed to larger plane types
while Airbus' orders were more strongly skewed to smaller plane
types.
Note also that for some time Airbus
did
not disclose net new orders (although it does now), so for some
past years this information has been
calculated and derived from other information they release.
Who is the Largest Airplane
Manufacturer?
The definition of 'who is
the largest aircraft manufacturer' is open to some debate and is
surprisingly difficult to establish! Six measures could be used
:
-
The company with the most
planes in current service - this suffers from tracking
historical past sales rather than present and future sales
-
Annual sales - unfortunately,
because 'sales' typically occur up to five years before
delivery, the reality of a sale can vary enormously between
when it is first recorded and the plane is finally delivered
-
Annual deliveries - this is a
good measure - the number of planes actually delivered in a
year. But should all planes be counted with equal measure -
for example, an A380 costs almost five times a small 737!
Even this measure has some limitations
-
Dollar value of annual
deliveries - this would be a useful measure, but neither
Boeing nor Airbus wish to disclose the exact nature of the
discounts they give to customers. List prices can be
discounted as much as 30% and sometimes more, so it can be
hard to establish the actual dollar value of planes
delivered each year.
-
Corporate turnover - this may
include all sorts of income sources such as spare part
sales, maintenance, and training, in addition to basic
airline sales
-
Forward orders - due to the
rather subjective nature of what is a sale, and the
difference in importance between an order for a
big/expensive plane and a small/inexpensive plane, this too
is a less than fully accurate measure
General Notes
For additional information
about plane types from all manufacturers, visit our page of
data on airplane types.
That page also contains
notes about how the information was gathered and the inherent
limitations in accuracy of the information displayed.
Read more in the rest of this
five part series
Part 1 : Boeing's early
years
Part 2 : Boeing's best
years
Part 3 : Boeing in decline
Part 4 : Does Boeing have
a future
Part 5 : Key facts and
figures about Boeing, its planes, and its competition
If you liked this, you might also enjoy our multi-part series 'Airbus
Fires the First Shot in the New A320/737 War with Boeing'.
Related Articles, etc
|
If so, please donate to keep the website free and fund the addition of more articles like this. Any help is most appreciated - simply click below to securely send a contribution through a credit card and Paypal.
|
Originally published
26 Dec 2003, last update
30 May 2021
You may freely reproduce or distribute this article for noncommercial purposes as long as you give credit to me as original writer.
|